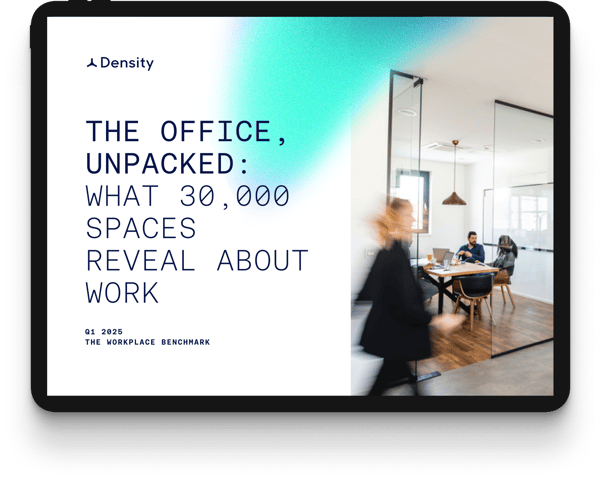
THE OFFICE, UNPACKED: WHAT 30,000+ SPACES REVEAL ABOUT WORK

The RTO wave didn’t crash—it keeps rolling. And in its wake, the office continues to evolve. So what’s actually changed?
We analyzed over 30,000 workspaces across 44 cities worldwide to uncover how workplaces are being used in the first quarter of 2025—and what that says about the future of work.
Our latest report, The Office, Unpacked, delivers real data, zero fluff.
Here's what we found:
📈 Utilization is on the rise.
Daily peak utilization hit 47% in Q1 2025—up from 43% in the year-ago quarter and the highest we’ve seen since launching the Workplace Benchmark in 2023.
🏢 RTO is no longer just talk.
55% of companies made moves in the past year to bring people back into the office—some gently, others with more of a push.
📅 Tuesday is the office champ for most popular office day.
Wednesdays and Thursdays follow close behind, forming a strong midweek attendance trio.

What you’ll get in the full report:
 |
Data from 30,000+ office spaces on global occupancy + utilization |
 |
Industry-by-industry insights on: 🕒 Avg. collaboration time per person, ⏳ Avg. workday length, 📊 Workspace efficiency rates |
 |
A snapshot of where companies land on the remote-to-in-office spectrum—and how that’s shaping the workweek |
If you want to know what’s actually happening in modern offices—not just what your LinkedIn feed thinks—this is the report to read.
Get the report
|
© 2025 DENSITY • 33 NEW MONTGOMERY ST, SUITE 500, SAN FRANCISCO, CA 94105 |